
Part 1. Mr. Beta
Right. Warnings first. This is the most geekish post I’ve ever placed here. If you’re not into stocks, ETFs and weird things like “beta”, “Sortino ratios” and “up-market captures,” or how many angels dance on the head of a pin, skip this one. It’s not as entertaining as my writing posts, or my stories of Johnny Depp or the story of the Philosophers’ Party or the Cat Who Ate Only Chicken. Not even close. And if you think it’s investment advice, it’s not. It’s purely my musings on some nerdish stuff that might, at best, amuse other nerds.
With that out the way, let’s start.
Yahoo Finance, Morningstar and other financial web sites publish – free to all readers – a stock attribute called “beta.” A beta of 1 supposedly means the stock price should change at the same rate as the broader stock market. A beta of, say, 2 supposedly means the stock price should rise and fall twice as fast as the broader market. I.e. it’s a volatile stock. A beta of, say, a half, means the stock price should rise or fall only half as much as the broader market. I.e. the stock should be less volatile than the broad market. And a negative beta of say, minus one, means the stock price should rise and fall at the same rate as the broader market but in the opposite direction, i.e., the stock price should rise when the broader market falls and vice versa. This might be a good stock for diversification and to hedge risks against the broader marker.
When I occasionally consider buying a stock/ETF (very modestly, I’m no Rockefeller) I like to think about beta. It’s useful to me in thinking about risk and volatility, and I like using it despite some flaws I’ll mention below. But the above popular description of beta is a huge oversimplification.
To be more precise, beta shows a stock’s price change compared to the underlying market price change, BUT ONLY TO THE EXTENT THE TWO HAVE A CORRELATION. And if the correlation is weak, beta may not be a good predictor of how the stock reacts to market movements.
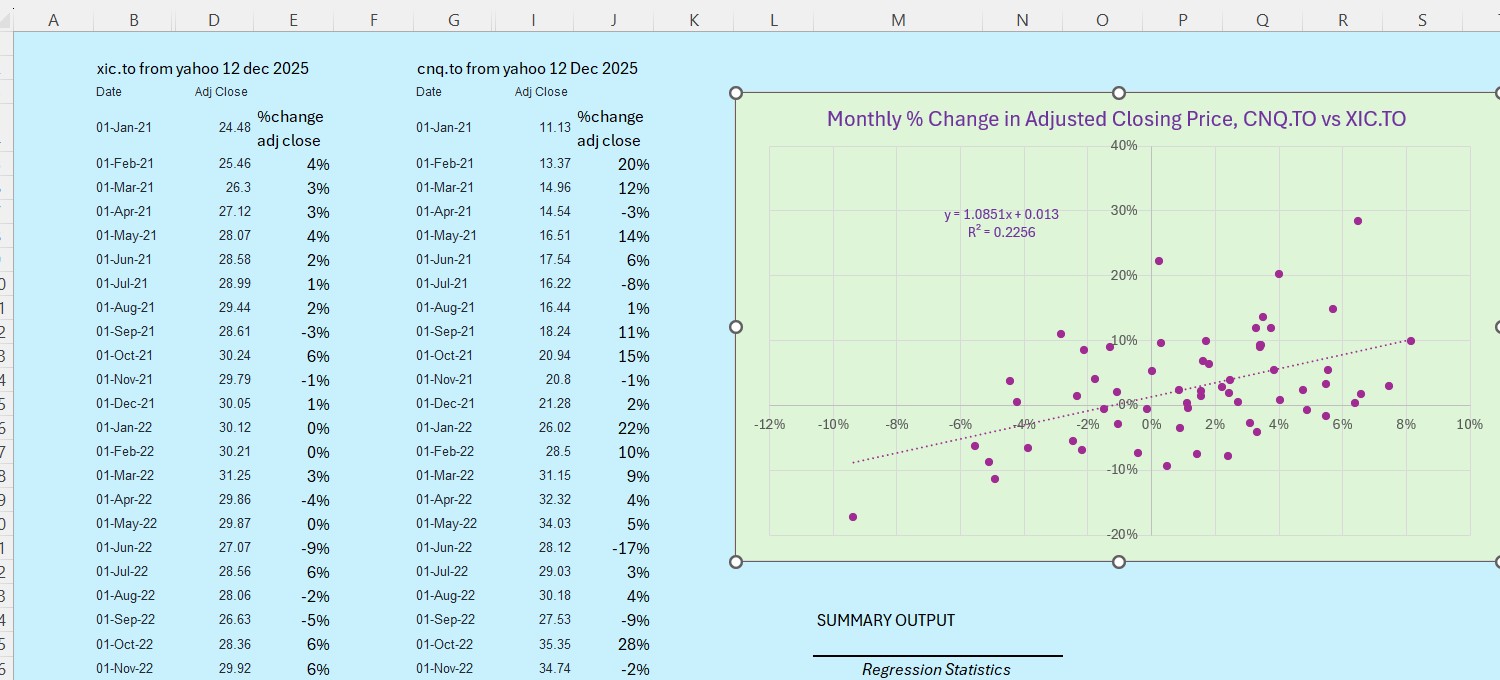
As an example let’s take the oil and gas stock CNQ, Canadian Natural Resources, as listed on the Toronto Stock Exchange in Canadian dollars. The beta listed for this stock by Yahoo in early December 2025 is 1.09. That’s based on Yahoo’s monthly five-year price history using adjusted closing prices.
[Detail: I was able to duplicate Yahoo’s beta calculations successfully as follows: I got Yahoo to list a monthly five-year adjusted closing price history for CNQ.TO and, as a proxy for the broader Canadian stock market, I used the monthly five-year adjusted closing price history for the ETF “XIC.TO.” XIC is the “iShares Core S&P/TSX Capped Composite Index” ETF. TSX stands for the Toronto Stock Exchange.
For calculating the beta, I took these adjusted closing prices, calculated the month-to-month percentage changes in each and calculated a beta of 1.085 – essentially the same result as the Yahoo listing.
(In this case, to my surprise, the unadjusted closing price gave a fairly similar result, beta = 1.07, but I don’t recommend using unadjusted prices.)]
To show how poorly correlated these two are, here’s my scatter plot of the monthly percentage price changes in CNQ vs. XIC. XIC here represents the broader Toronto stock market.
The horizontal axis is for XIC percentage price changes, the vertical for CNQ. Since I have five years of monthly data, I will get 60 points (well, actually 59) on the graph. The trend line represents the best straight line fit to all these dots. And the slope of the trend line, 1.085, is beta. That is, for every 1% change in the Toronto stock market prices, one might expect CNQ prices to change by 1.085%.
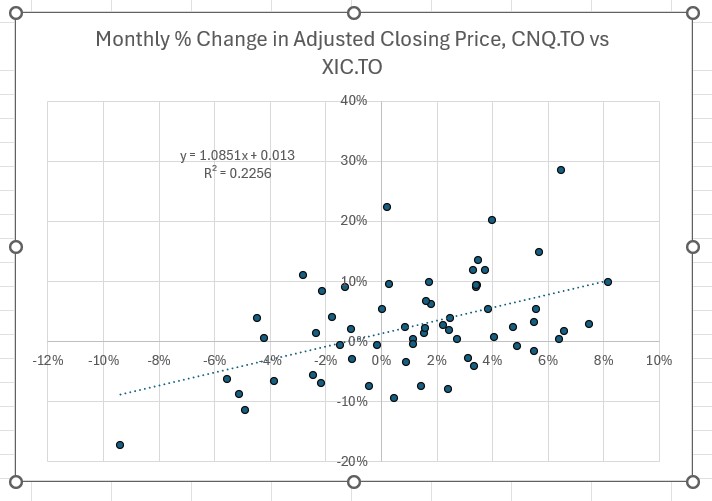
But oh, my, that scatter plot looks more like a drunkard trying to walk a straight line than a good correlation. The measure of correlation for the above is something called “r-square” and, in this case, r-square =0.21. That means that changes in the broad market price only explain 21% of the changes in CNQ price. Or, stated more accurately, since correlation is not causation, CNQ and the broad market only have a 21% correlation.
Curiously, many financial web sites like Yahoo and Morningstar will publish the r-square values for ETFs, although not for individual stocks. So for individual stocks, one has to use one’s own judgment of whether the correlation is good, and whether beta may be a useful predictor of volatility, or whether there are better predictors (if there’s demand I will discuss some in a potential part 2 to this).
Aside from correlation, there is another issue that plagues beta. Namely, there is no single version of beta, any more than there is a single recipe for pizza.
Let me expand on that.
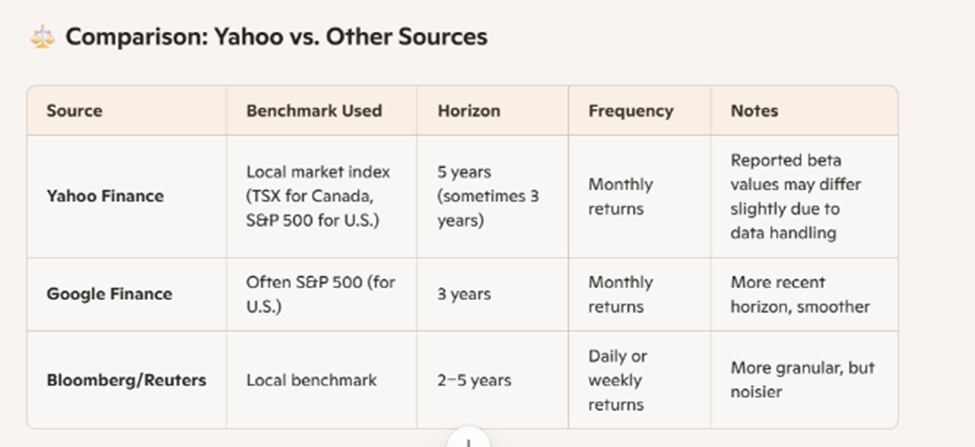
Yahoo and I used a five-year monthly adjusted-close price history above. Some sites use a three-year history, or some other time span. Some may use weekly instead of monthly prices. And perhaps some sites use unadjusted closing prices. And it’s rarely clear what broad market they’re using for their correlation. If the beta being published is for a US issued ETF that tracks Chinese banking stocks, say, then is the correlation to the US market, the Chinese market or the Chinese banking market? Worse, if you ask Yahoo for monthly data it will typically give you data from the first of the month. Another site may provide mid-month data. Then again, if you’re looking at the beta for an exchange traded fund (ETF), the beta might change as the ETF changes its holdings. And of course, which start and end dates you use will have a big impact too.
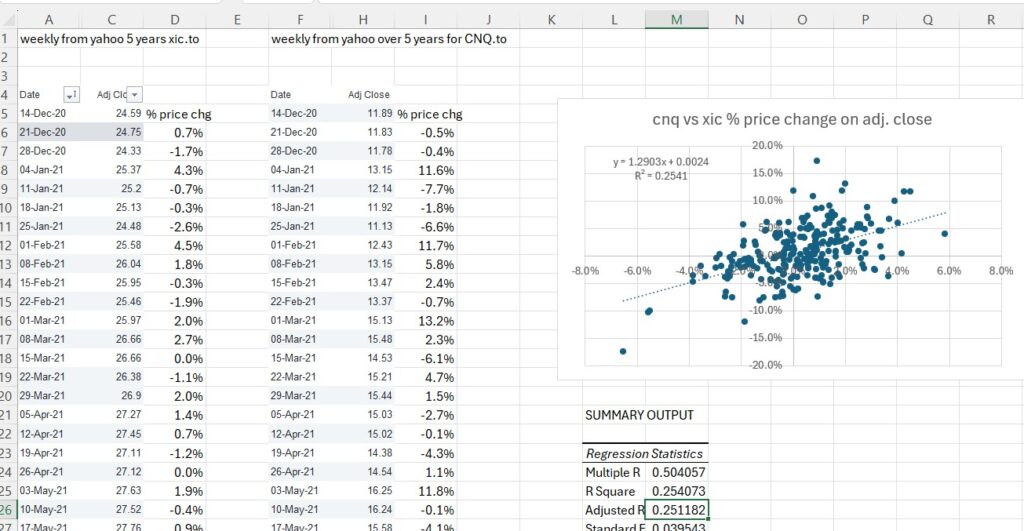
Here’s what happens if I calculate the same CNQ.TO beta with Yahoo adjusted closing prices, but this time I use weekly instead of monthly five-year price history.
The beta jumps from 1.09 with an r-squared of 0.22 to 1.29 with an r-squared of 0.25.
To show yet more examples of how variable beta estimates, can be, here’s what the GOOGLEFINANCE function within Google Sheets thinks the beta value of CNQ on the Toronto Stock Exchange should be:
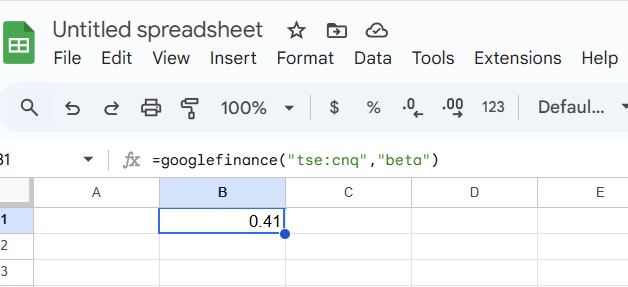
This is spectacularly different from Yahoo and Morningstar and my calculations above. And again, it’s hard to know why Google thinks so differently. Is it using a US reference market instead of a Canadian reference market? Is it using the US dollar listing for CNQ? Is it using one-year weekly data?
So measuring beta is like comparing family members in a group photo. Sure, it will give you some comparison, but the comparison may change depending on when and how the photo was taken and how the group was positioned.
Here’s what ChatGPT says about this:
One takeaway from all this confusion of beta values might be to stick to a single source of betas for consistency, say Yahoo, and use those single-source betas for comparative purposes across stocks. The values might not agree with another site’s values, but at least one might be comparing/ranking different stock betas with a consistent methodology.
Wouldn’t it better, though, if there was a freely available beta measure where one had clear view and/or control of the parameters like time span, periodicity, reference market etc.? And where one could see the r-square values? There is an answer to that, and if there’s enough interest in this nerdish post (let me know in the comments section below) I may create part 2 with some answers, maybe some references to a freely available program and some interesting complementary measures like down-market captures etc.